Article
Vialab is well-known for its expertise in the field of information visualization. Can you tell us more about its research activities and expertise?
The Visualization for Information Analysis lab (vialab) is a research group at the University of Ontario Institute of Technology, lead by Dr. Christopher Collins. The lab’s research focuses on information visualization, with special attention on text and document analysis. The lab also conducts research in human-computer interaction, with a focus on integrating interactive surfaces, eye-tracking, and novel hardware devices with analytics applications. Research themes include computer supported learning, passwords and security, digital humanities, health analytics, visualization scalability, visualization perception, mobile visualization, and explainable machine learning. Research conducted at vialab has been featured in popular media such as the New York Times Magazine, the Toronto Star, and CBS Sunday Morning. The lab maintains a range of collaborations with other academic researchers in Canada and worldwide, as well as industrial collaborations with partners such as Microsoft Research, VerticalScope, and Quillsoft. Over 50 trainees across all levels of study have worked in the lab since 2011.
As part of the CO.SHS project, Vialab is developing a software suite comprised of five research and visualization tools allowing to explore vast corpora of textual documents. They are more specifically designed for the humanities and social sciences. Can you tell us briefly about these and give us an update of their development since the last CO.SHS Workshop (see the summary here)?
We have developed a set of tools that we envision scholars of the humanities and social sciences using alongside simple search bars like the ones that already exist on the Erudit platform. For our first tool, Textension, we have attempted to bring near real-time visualization to scholars who lack the technical skill to make that happen. By simply taking a photo of a book page or uploading an image, our framework processes that still picture and turns it into an interactive visualization. In this way, we give our users access to Natural Language Processing and interactive visualizations with little more than them knowing how to take a photograph with their phone.
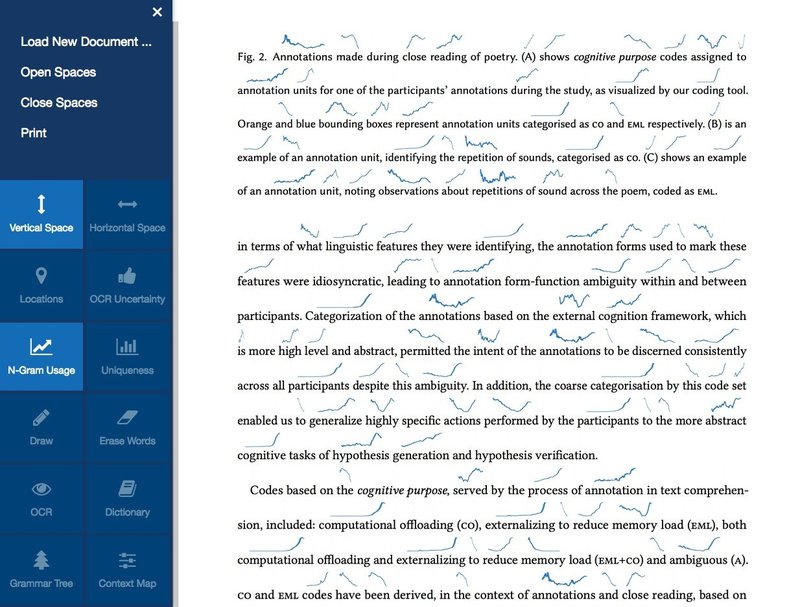
- Figure 1: The Textension interface showing automatically inserted sparklines that show the history of recognized words in the English language.
Our second tool is an augmented search platform that allows users to search the Erudit corpus in new and exciting ways. In our interviews with CO.SHS scholars we found that they all talked about a similar problem: How to ask questions of document corpora. We designed our search tool with several interactive pieces that allow users to build search queries in different ways. While we include a simple search bar (because at times that is all that is needed), we also allow users to upload documents, which we then model, and subsequently return similar documents to them from the larger corpora. We also take those models and build an interactive visualization that allows for serendipitous search through a visual hierarchy of synonymous terms. By allowing several ways to construct a search query we hope to contribute to scholars being able to ask their questions.
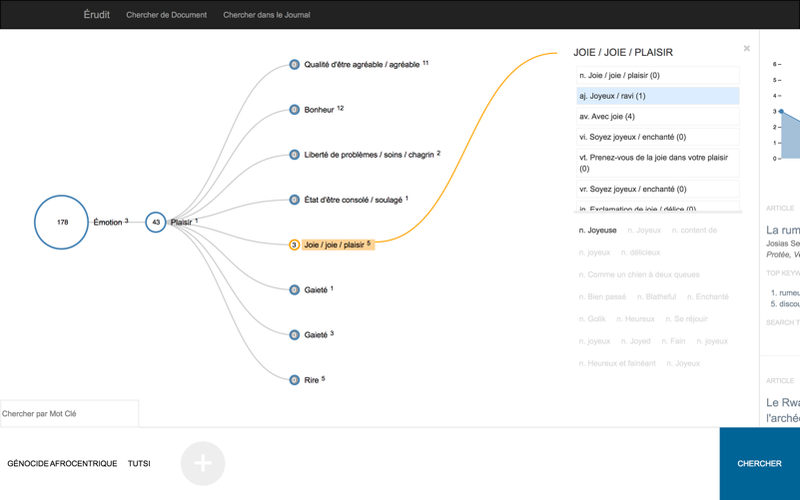
- Figure 2. The interactive search interface. Here we show the visualization that lets users find related search terms to the ones that already exist in their query
The third project was born out of a question that also resulted from our early interviews with CO.SHS members. Their research question was about how knowledge transferred in and out of Quebec. We started to look into this problem by building a web based interactive map that shows collaborations between research institutions and authors on papers from the Erudit corpus. Users can apply search filters and zoom in and out to try to find what we are calling ‘knowledge clusters’ by geographic location.
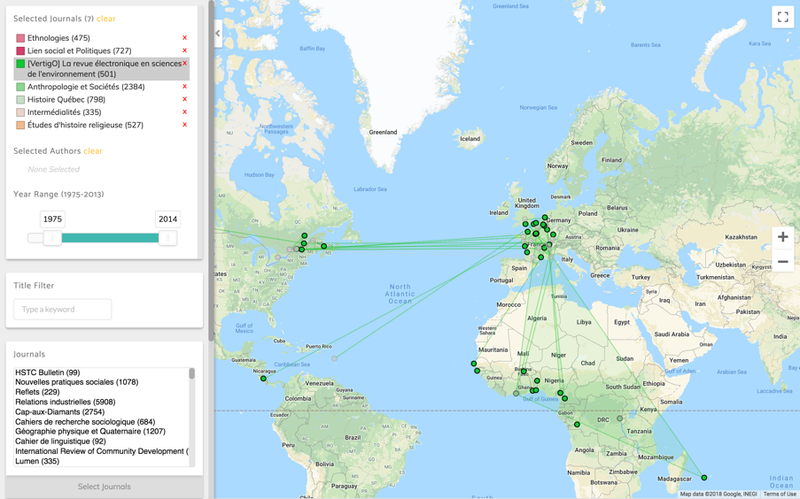
- Figure 3: The interactive 'knowledge' map
The fourth project is one that tries to drive web traffic on the journal level. Using our document modelling techniques we allow users to upload a document and then we match that document with the most similar journals in Erudit. We then produce a visual ordered list that shows users which journals their document would most likely fit into. We imagined this process as another way to navigate the corpus for scholars who were having trouble asking questions.
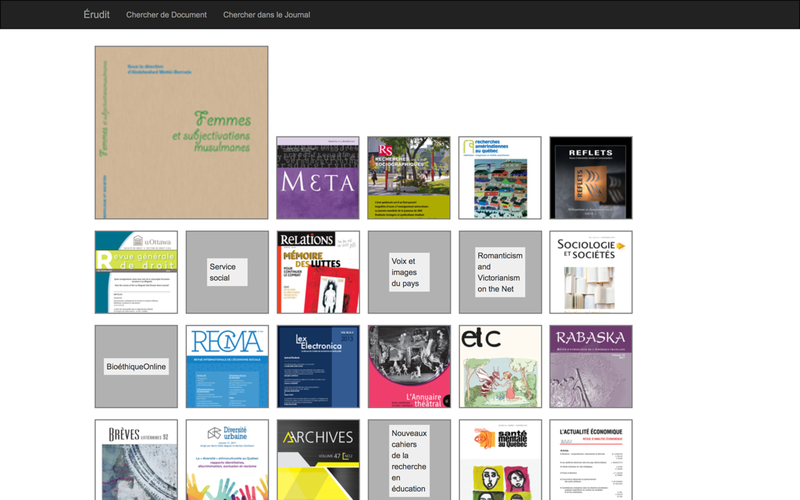
- Figure 4: The journal matching interface
Focus on citation context analysis
At the present time, you are working more closely on a fifth project, Citation Galaxies, a visual analytics tool for citation context analysis. First things first, can you remind us what is citation context analysis?
Citation context analysis is the process of investigating the language in scholarly documents that surround each individual citation. Bibliometric experts are using this language to help to understand exactly how, where, and why papers are being cited. This work has implications for understanding how funding dollars are being used and whether or not research projects are successful.
What is the specificity of this tool? What will be the main use cases?
Working with bibliometric scholars from The University of Montreal, we have built an interactive visualization platform for searching and marking up citation contexts. We provide the user with the ability to search for word sequences and define how much context surrounding a citation they are interested in. From this, we produce corpus-scale visualization that allows them to identify rule sets based on their own markup criteria. Currently this is being used to identify sentiment, but can be adapted to other interventions. The goal of this project is to have a semi-automated feedback loop that uses machine learning to suggest other rules that could help the scholars achieve quickly and accurately markup the corpus according to their interest. Citation Galaxies is meant to improve processes that are already taking place without removing the human element from the equation.
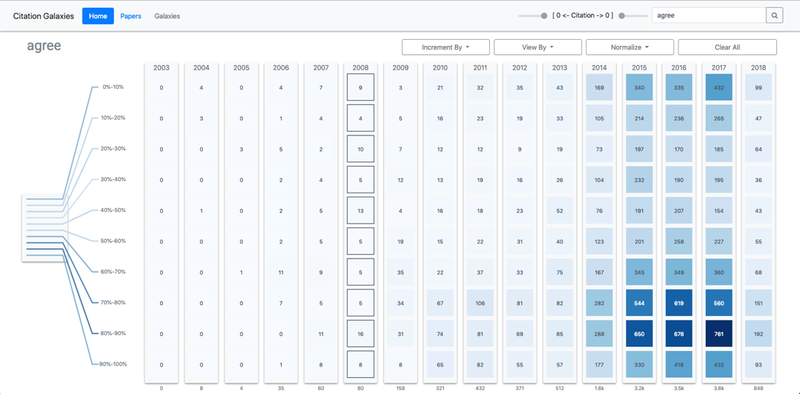
- Figure 5: An overview of how the specific search term "agree" distributes across an entire corpus
You seem to work very closely with the research community, and more specifically with the bibliometrics community to align your developments with their needs. Is that so?
Yes, this project has been developed using the concept of iterative design. The bibliometric experts are our stakeholders in that process. First, we built our ideas through inspiration from the more manual bibliometric methods described in their papers. We then refined our plan through several meetings to make sure that what we are producing will meet the needs of their research and will allow them to answer the questions that they have set out.
General approach
What is the overarching goal / method behind your software suite? Can you expand a bit on what is the most unique and innovative in your approach?
The overarching goal when developing these tools is to find ways to support the workflows of scholars in the humanities and social sciences without disrupting their existing practises. Too often tools are built that make claims of ‘revolutionizing’ the process. We tried to take a different stance. We wanted to build tools that fit in seamlessly with work that is already being done. We started our design process with in-depth interviews of the scholars whose work we wanted to support and tried to design all of our tools with their needs, and work, in mind. In terms of the uniqueness of our work, it is the conservative nature of the interventions. We try to avoid telling users what to do with their work and when you start from a design concept that is rooted in the support of existing practises it tends to hold you back in ways that are actually useful for producing workable tools.
What difficulties were you faced with up until now in developing your software suite? What is the work plan for the next steps?
I (Adam) often tell our graduates students that if I could go back and do my PhD all over again I would work with any data other than natural language! Although this is said facetiously, our problems almost always root in the simple fact that natural language as data is difficult to work with. It is always complex, always ambiguous, and always unruly when trying to organize into data sets. For each project the data wrangling stage, which is about organizing the available data in a way that makes it accessible by a system, takes a large amount of time. Unfortunately, there is no way to avoid this step and each project has its own pitfalls when going through it.
In terms of next steps, we are working closely with the technical team from Erudit on integration. Our first four tools are at a stage where they can be deployed and we are trying to figure out the best way to make that happen. Each project will also result in a research paper – some are in the final stages of publication, while others are in preparation for submission.